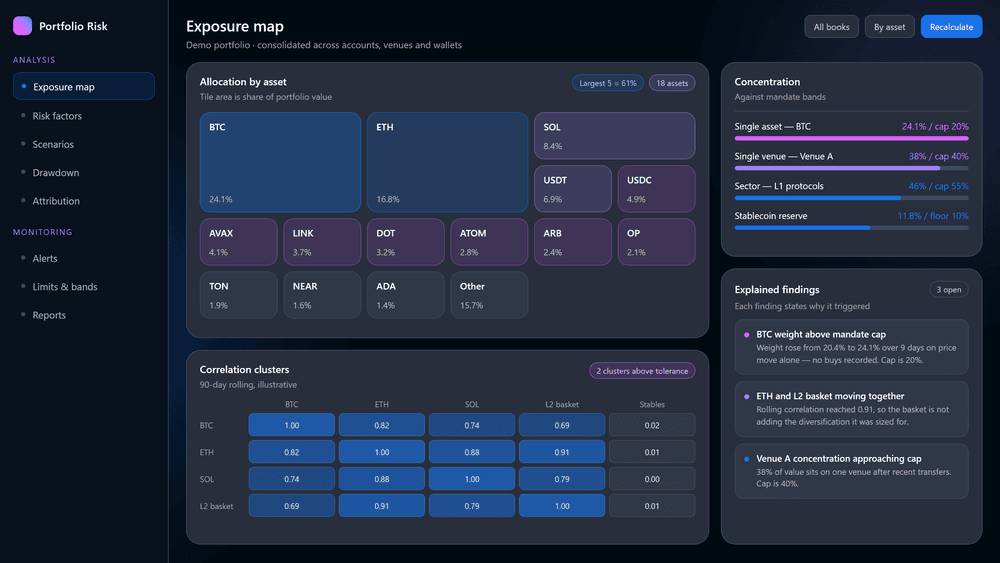

Consolidated exposure map
Allocation by asset, sector, book and strategy across every connected account, venue and wallet — firm-wide or scoped to a sleeve.
Portfolio risk analytics running 24/7 on live positions consolidated from every account, venue and wallet — exposure, scenario shocks, drawdown and correlation, and never a number without the reason behind it. Findings leave as instructions for approval.
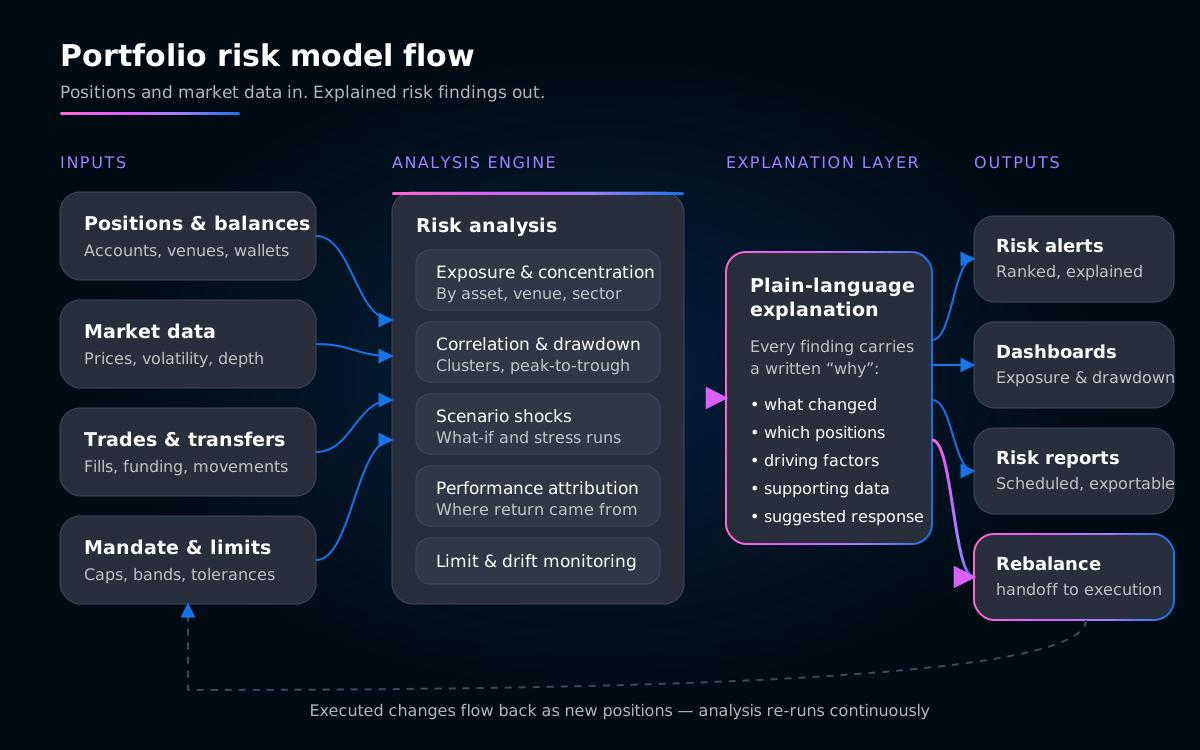
Seven stages run continuously against live data. Each one produces something a risk officer can read, not just a number to interpret.
Positions, balances and transfers pulled from every account, venue and wallet into one view, so exposure is measured against what is actually held — and trades come too, separating a weight that grew from buying from one that grew on price.
Weights are computed by asset, venue, sector, book and counterparty, then compared against the mandate bands you configured. The map shows distance to every limit, including the ones being approached rather than breached.
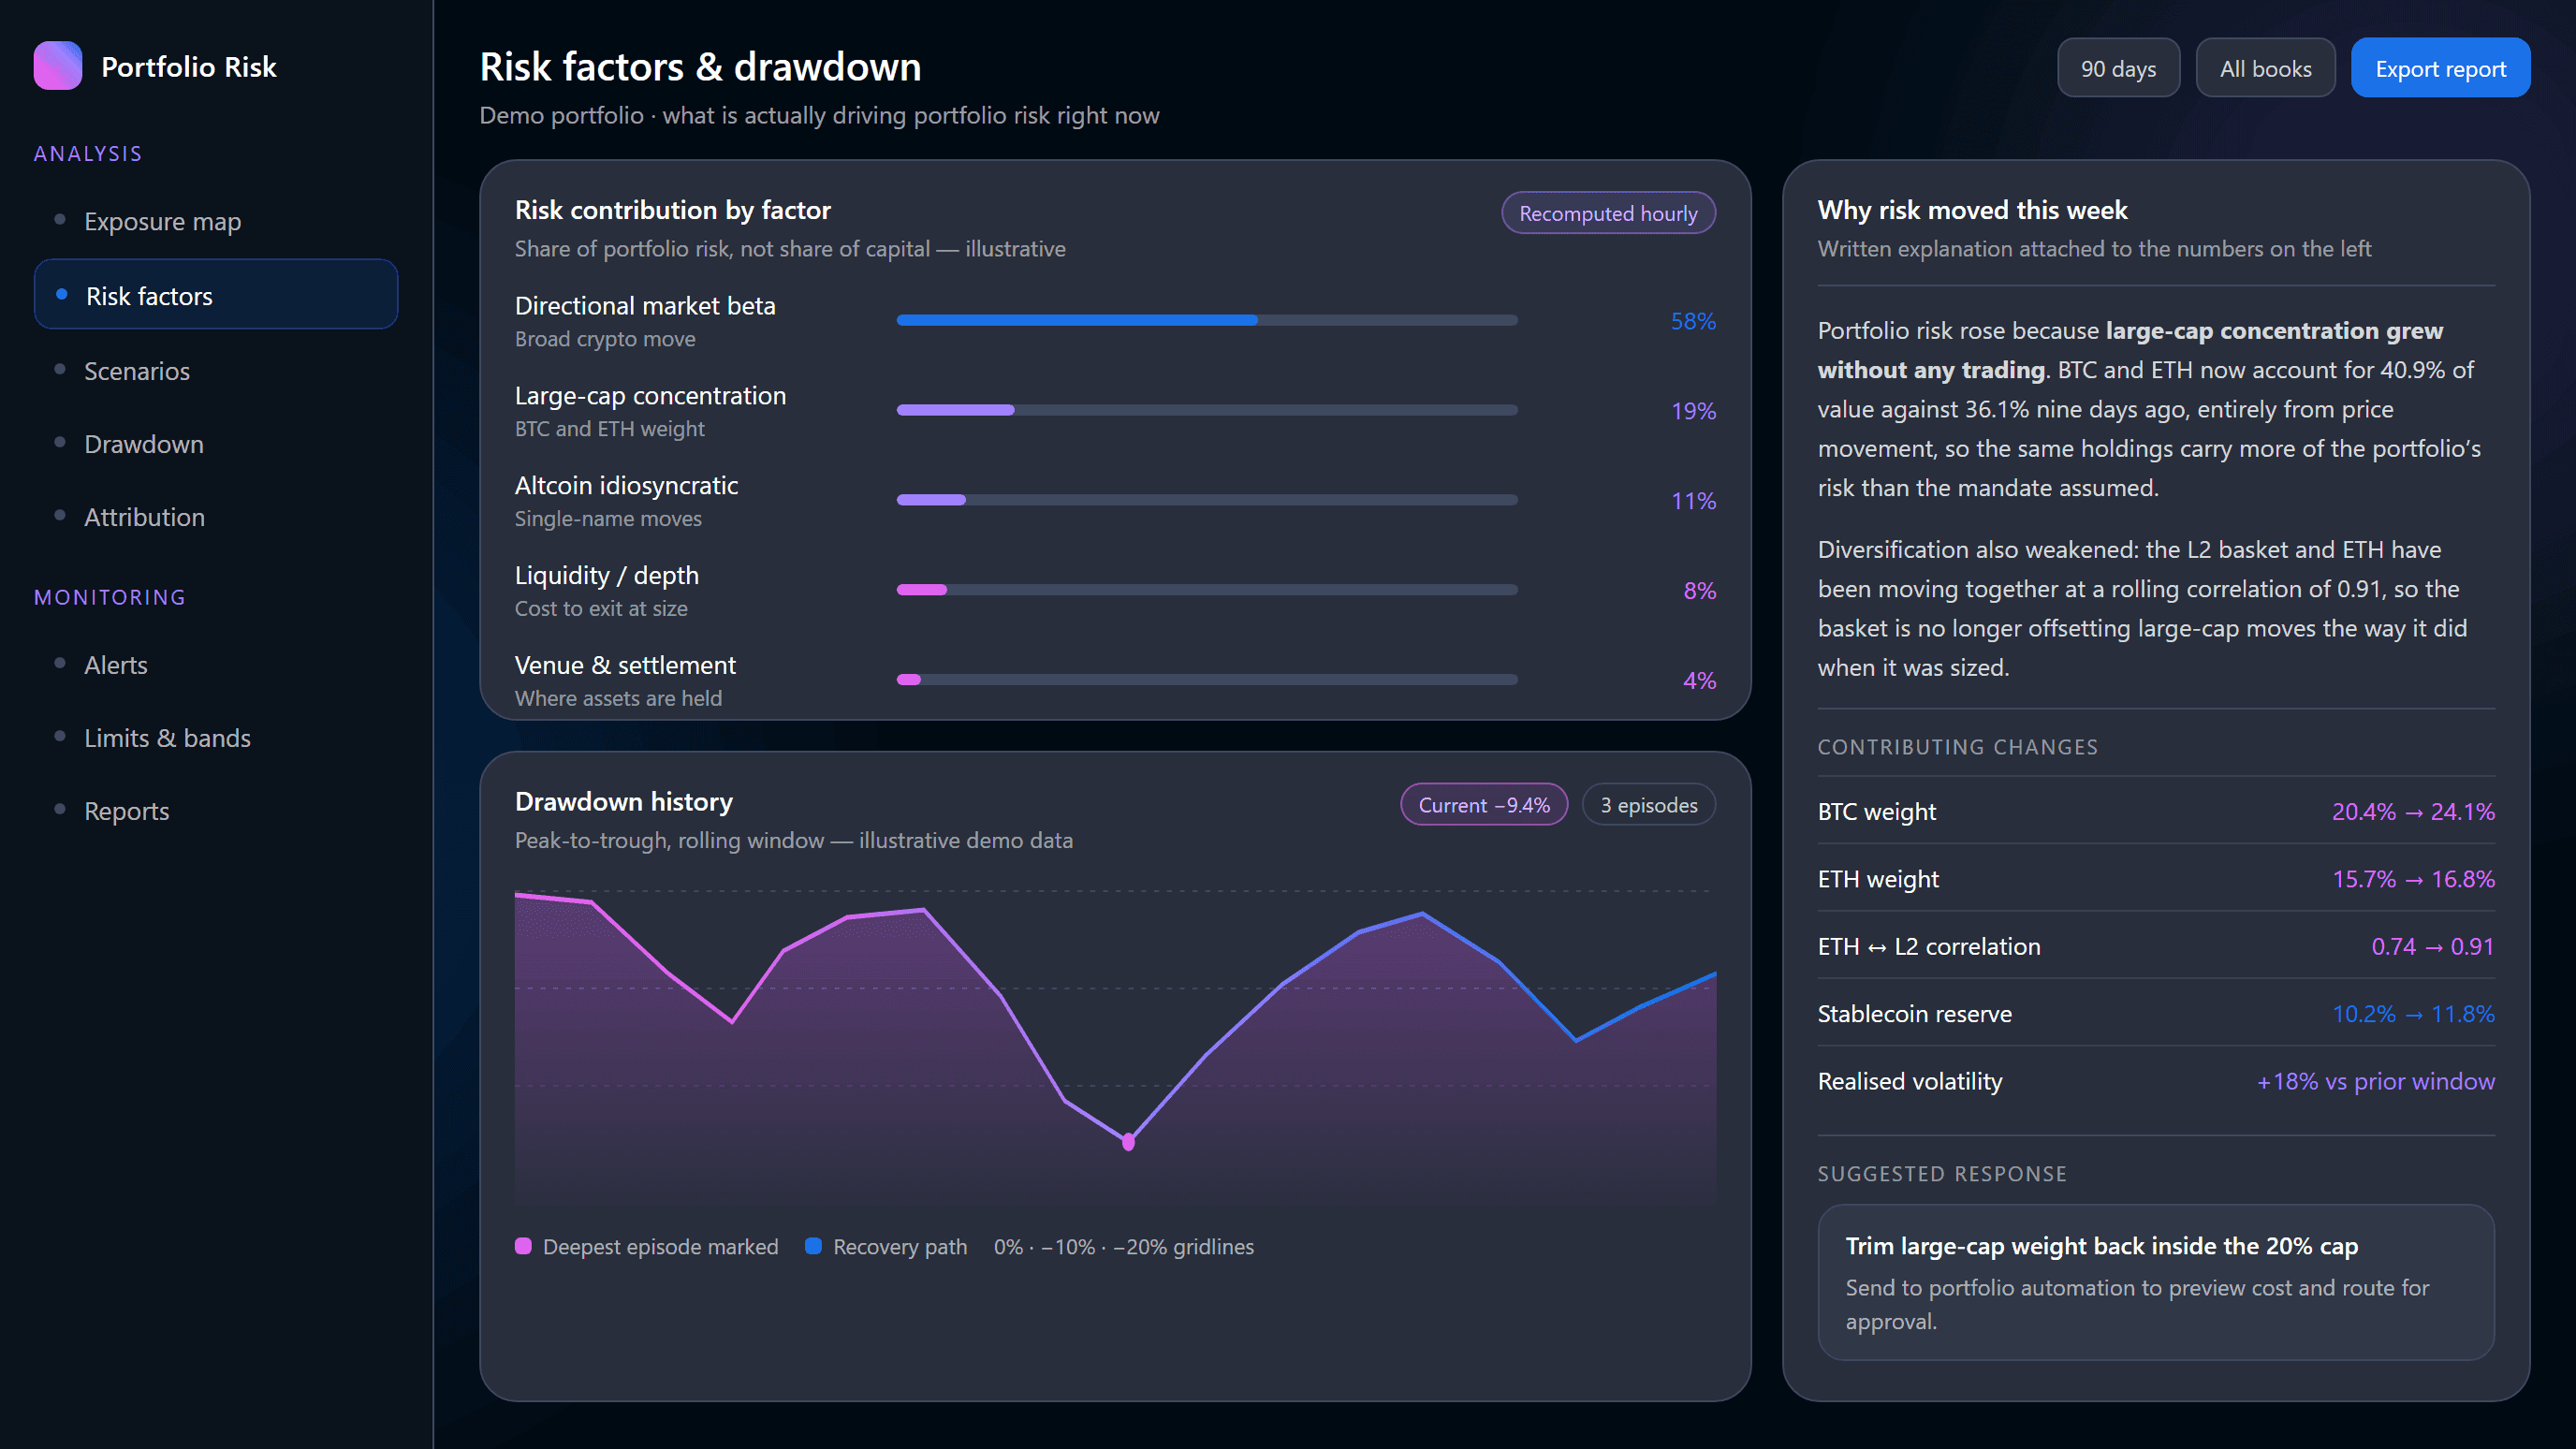
Rolling correlation is tracked inside each basket that exists to diversify, because a basket moving with the position it was meant to offset has stopped working. Drawdown is measured peak-to-trough per sleeve, with recovery tracked.
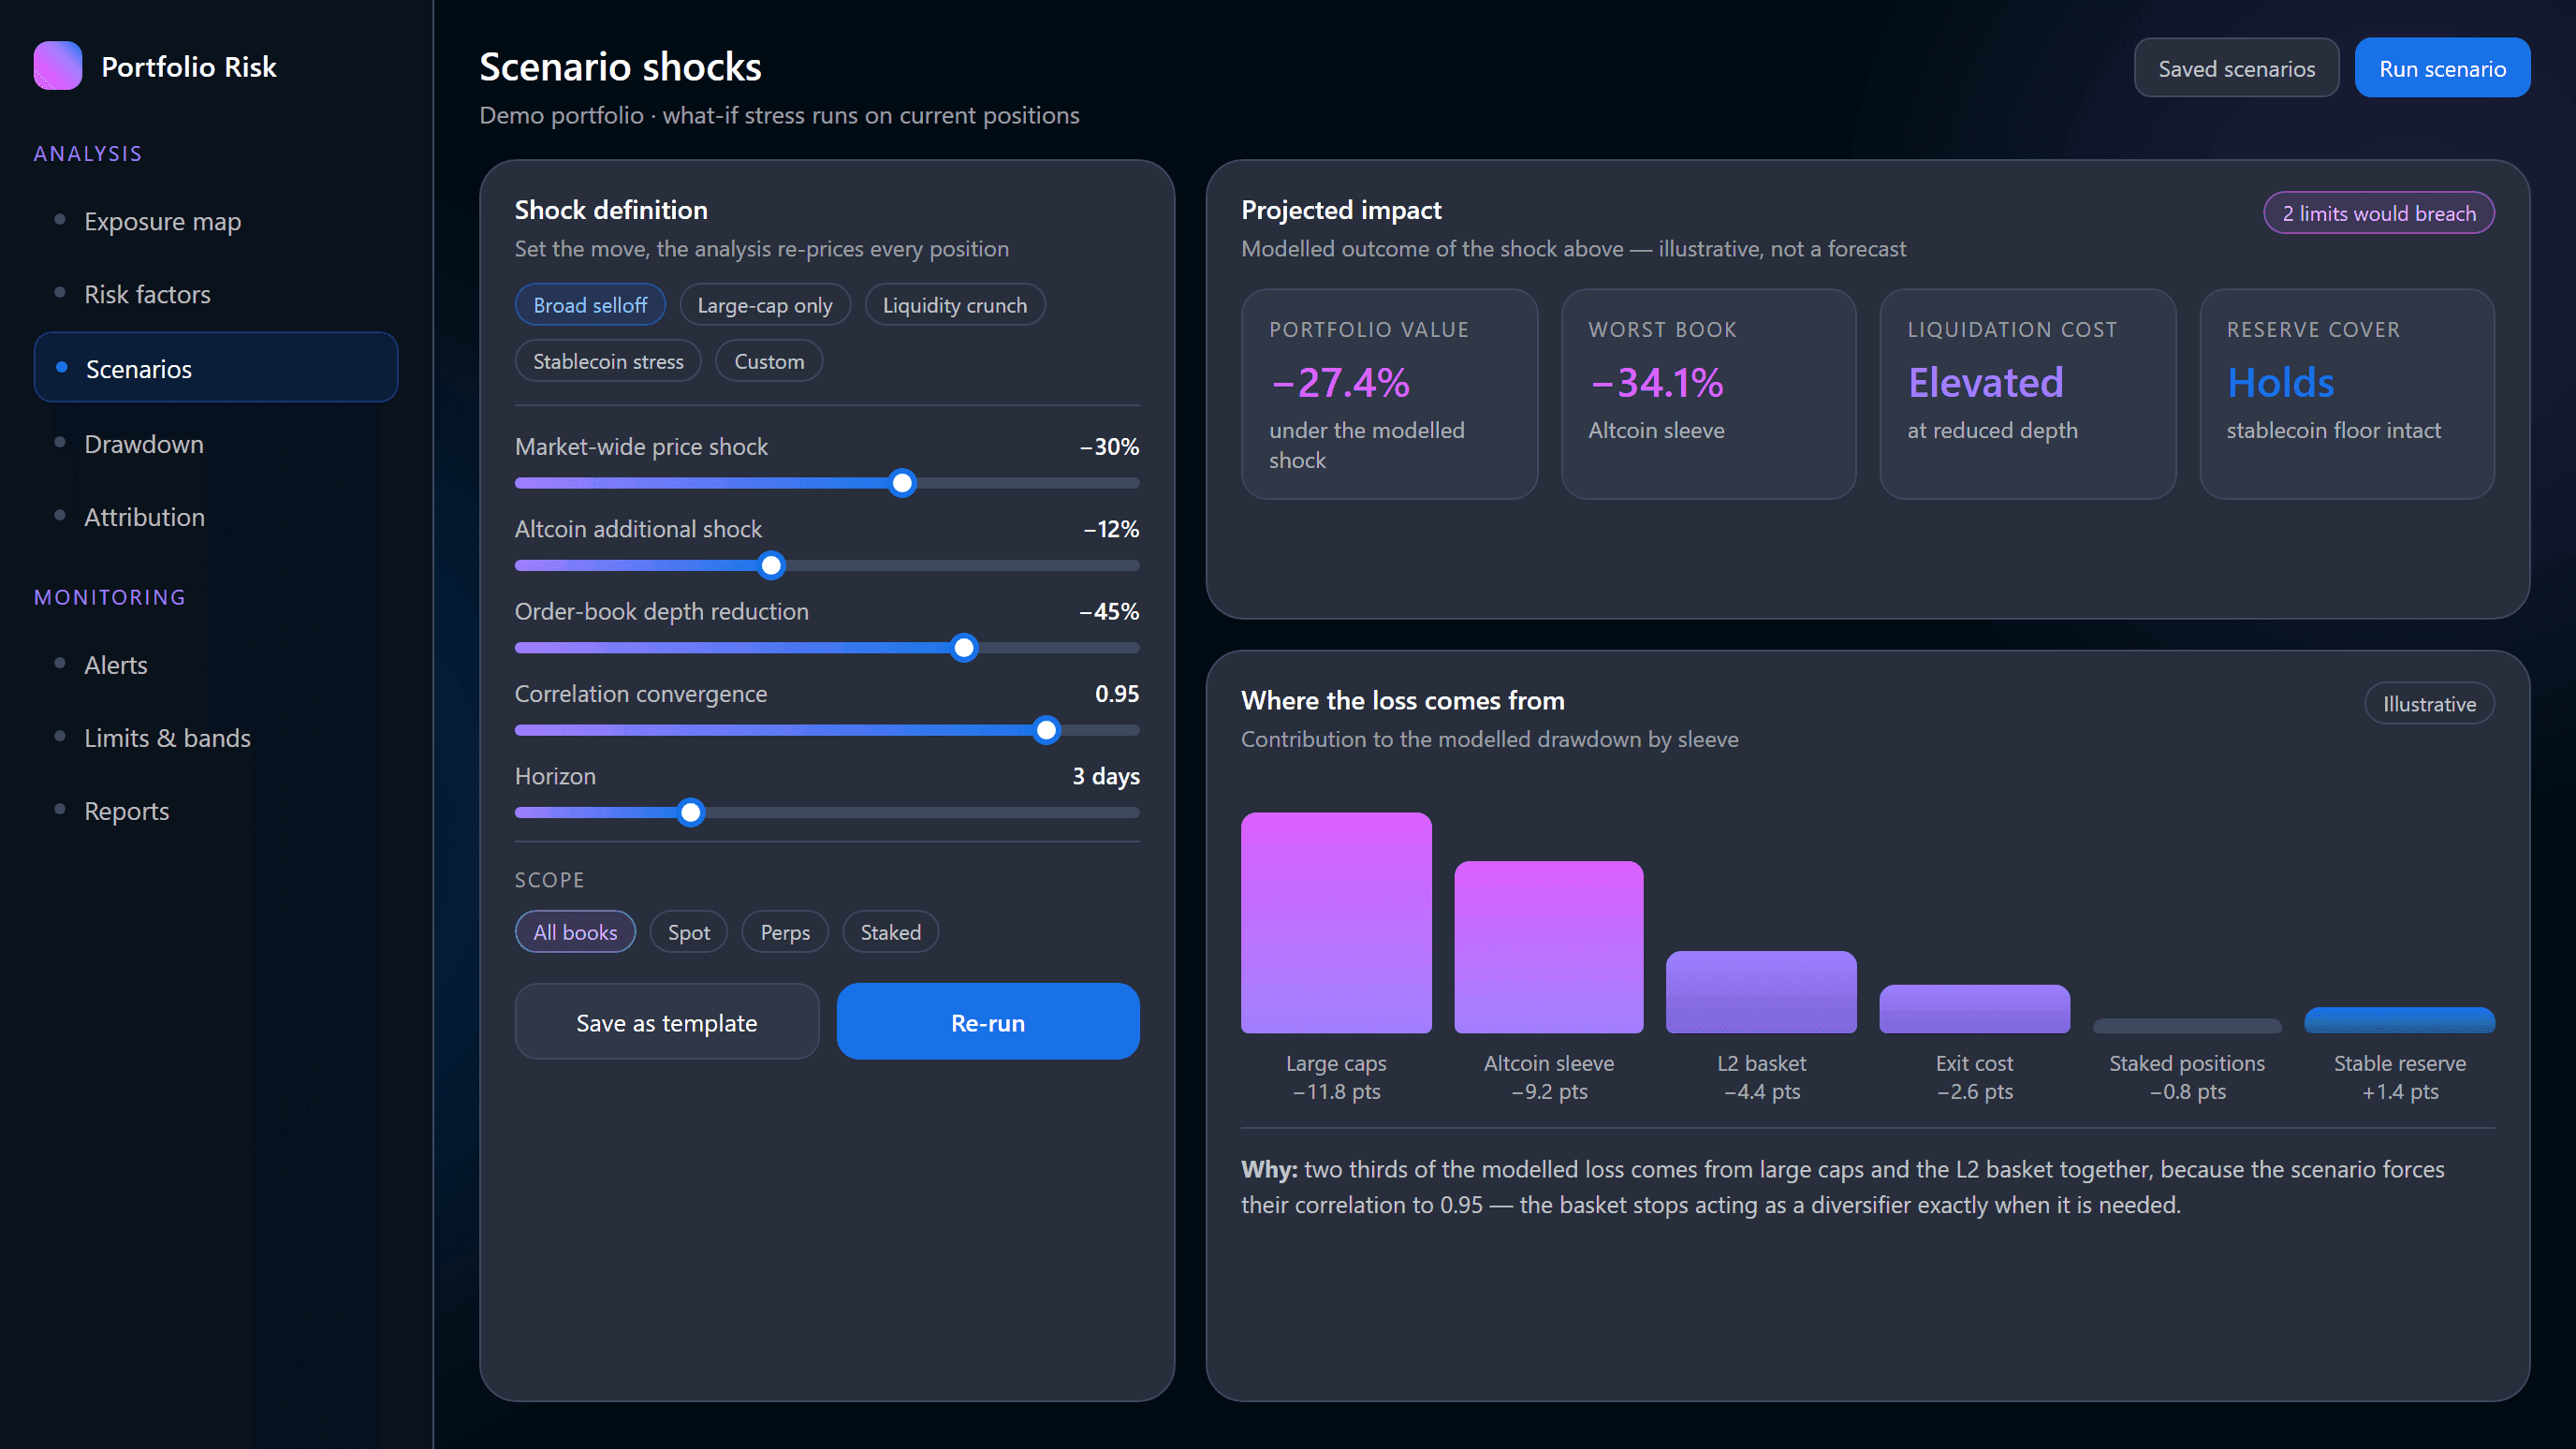
What-if shocks re-price the portfolio under a defined move: a market-wide drop, an altcoin move, reduced depth or correlations converging. The output names which sleeves drive the modelled loss — modelled outcomes, not predictions.
Return is decomposed across assets, sleeves, venues and time, so the source of a result is visible rather than assumed. Attribution separates broad market direction from position sizing from a handful of individual names.
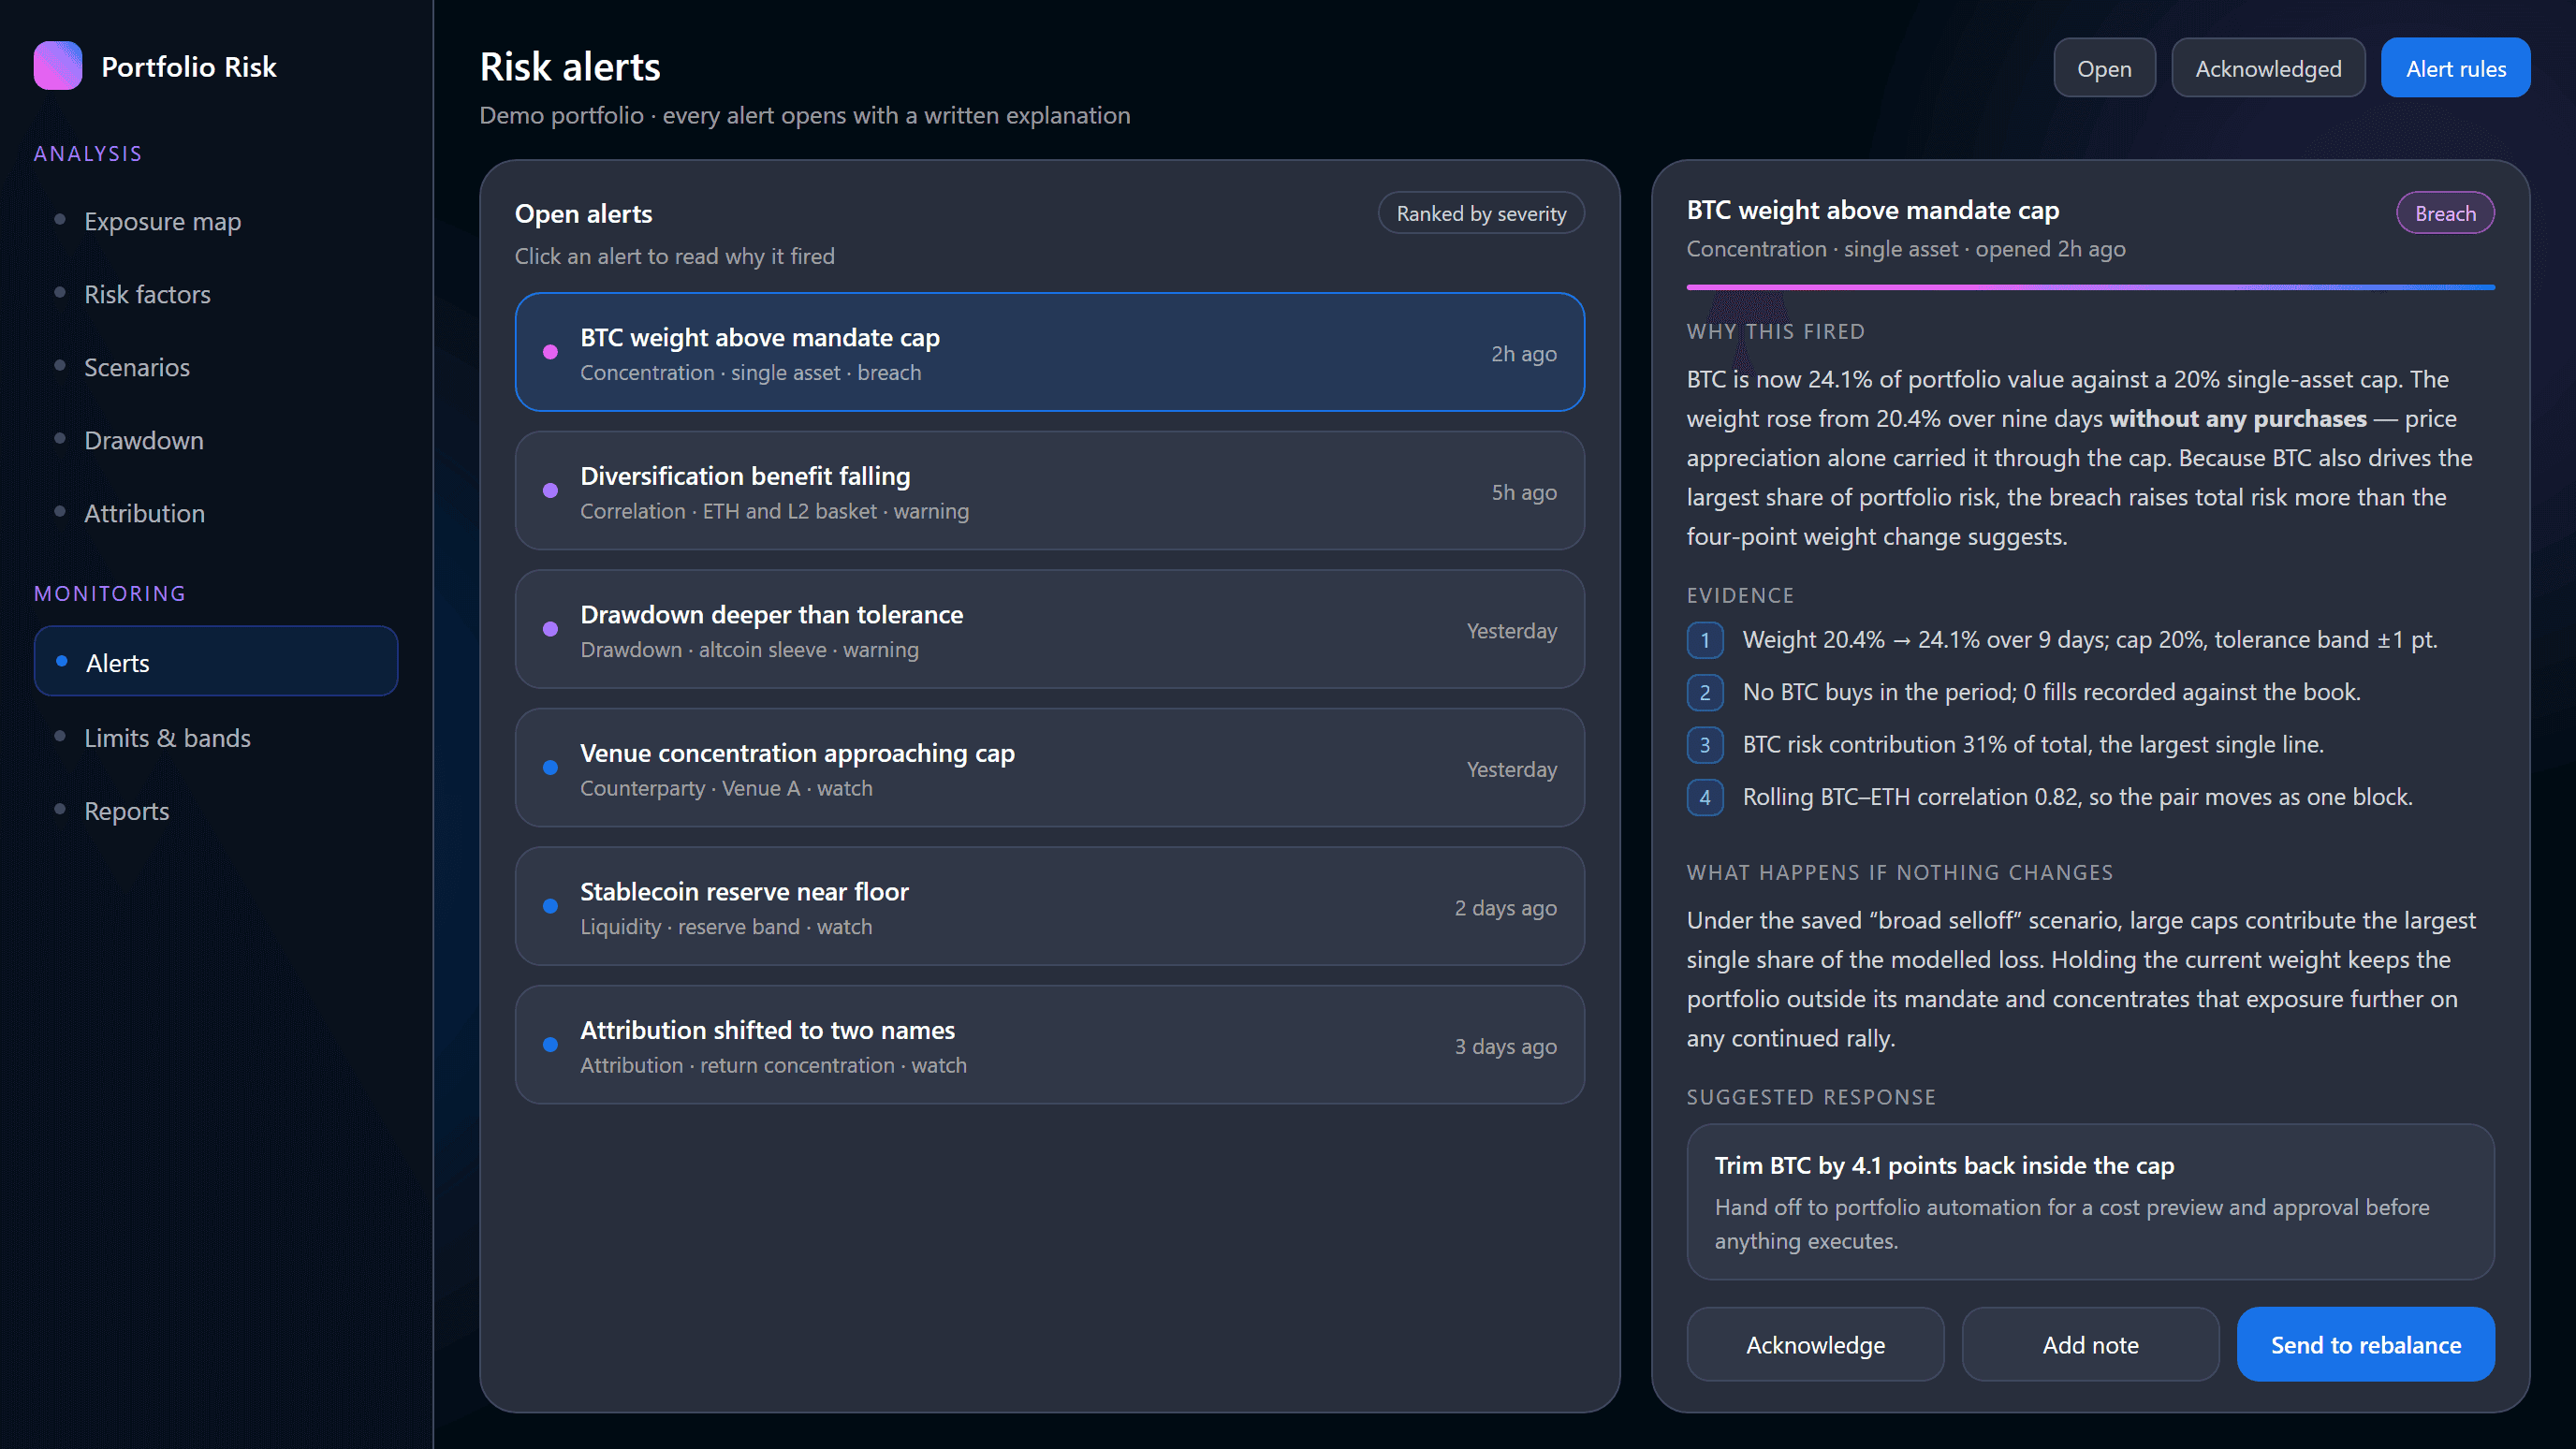
Every finding is written up before it is sent: what changed, which positions are responsible and a suggested response. Alerts are ranked by severity, so a breach reaches the risk officer while a watch collects in the digest.
Breach-level findings stay open until a named reviewer acknowledges them with a note. Threshold changes and handoffs are recorded, and scheduled exposure, attribution and scenario packs carry the explanation text attached.
The analysis engine sits between the portfolio and the people responsible for it. Nothing reaches an alert queue without passing through the explanation layer first.
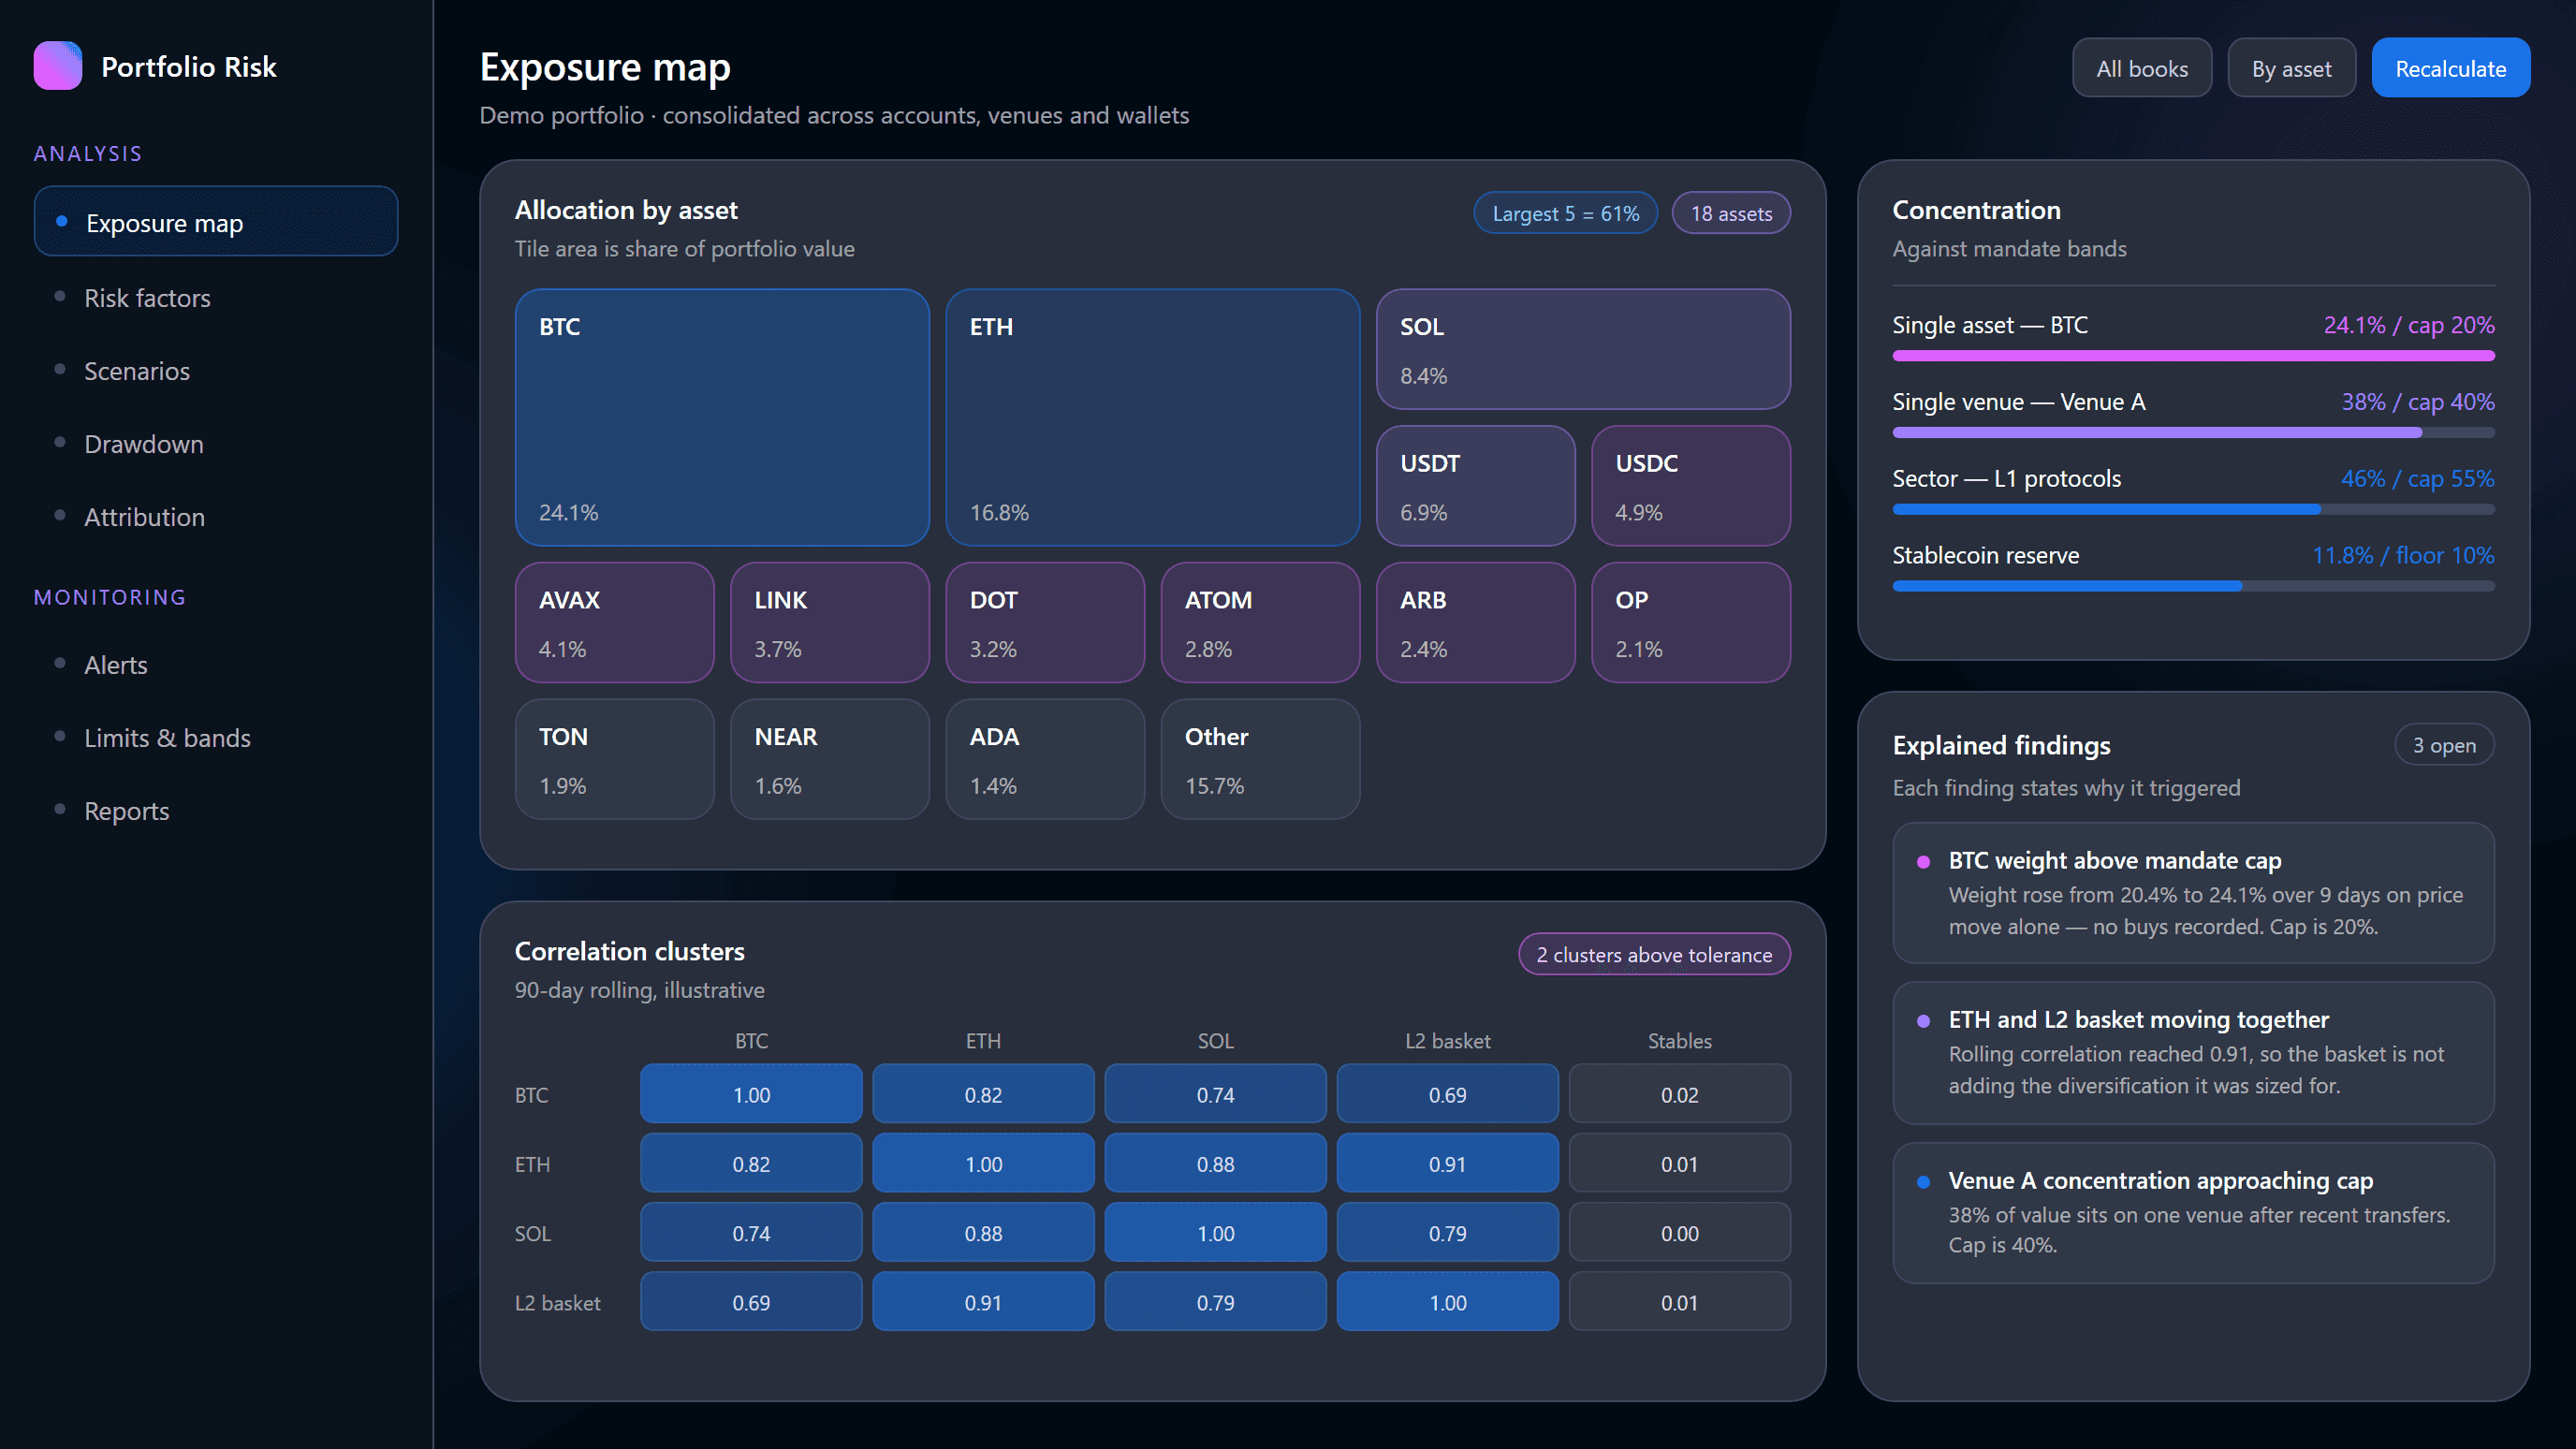
Allocation by asset, sector, book and strategy across every connected account, venue and wallet — firm-wide or scoped to a sleeve.

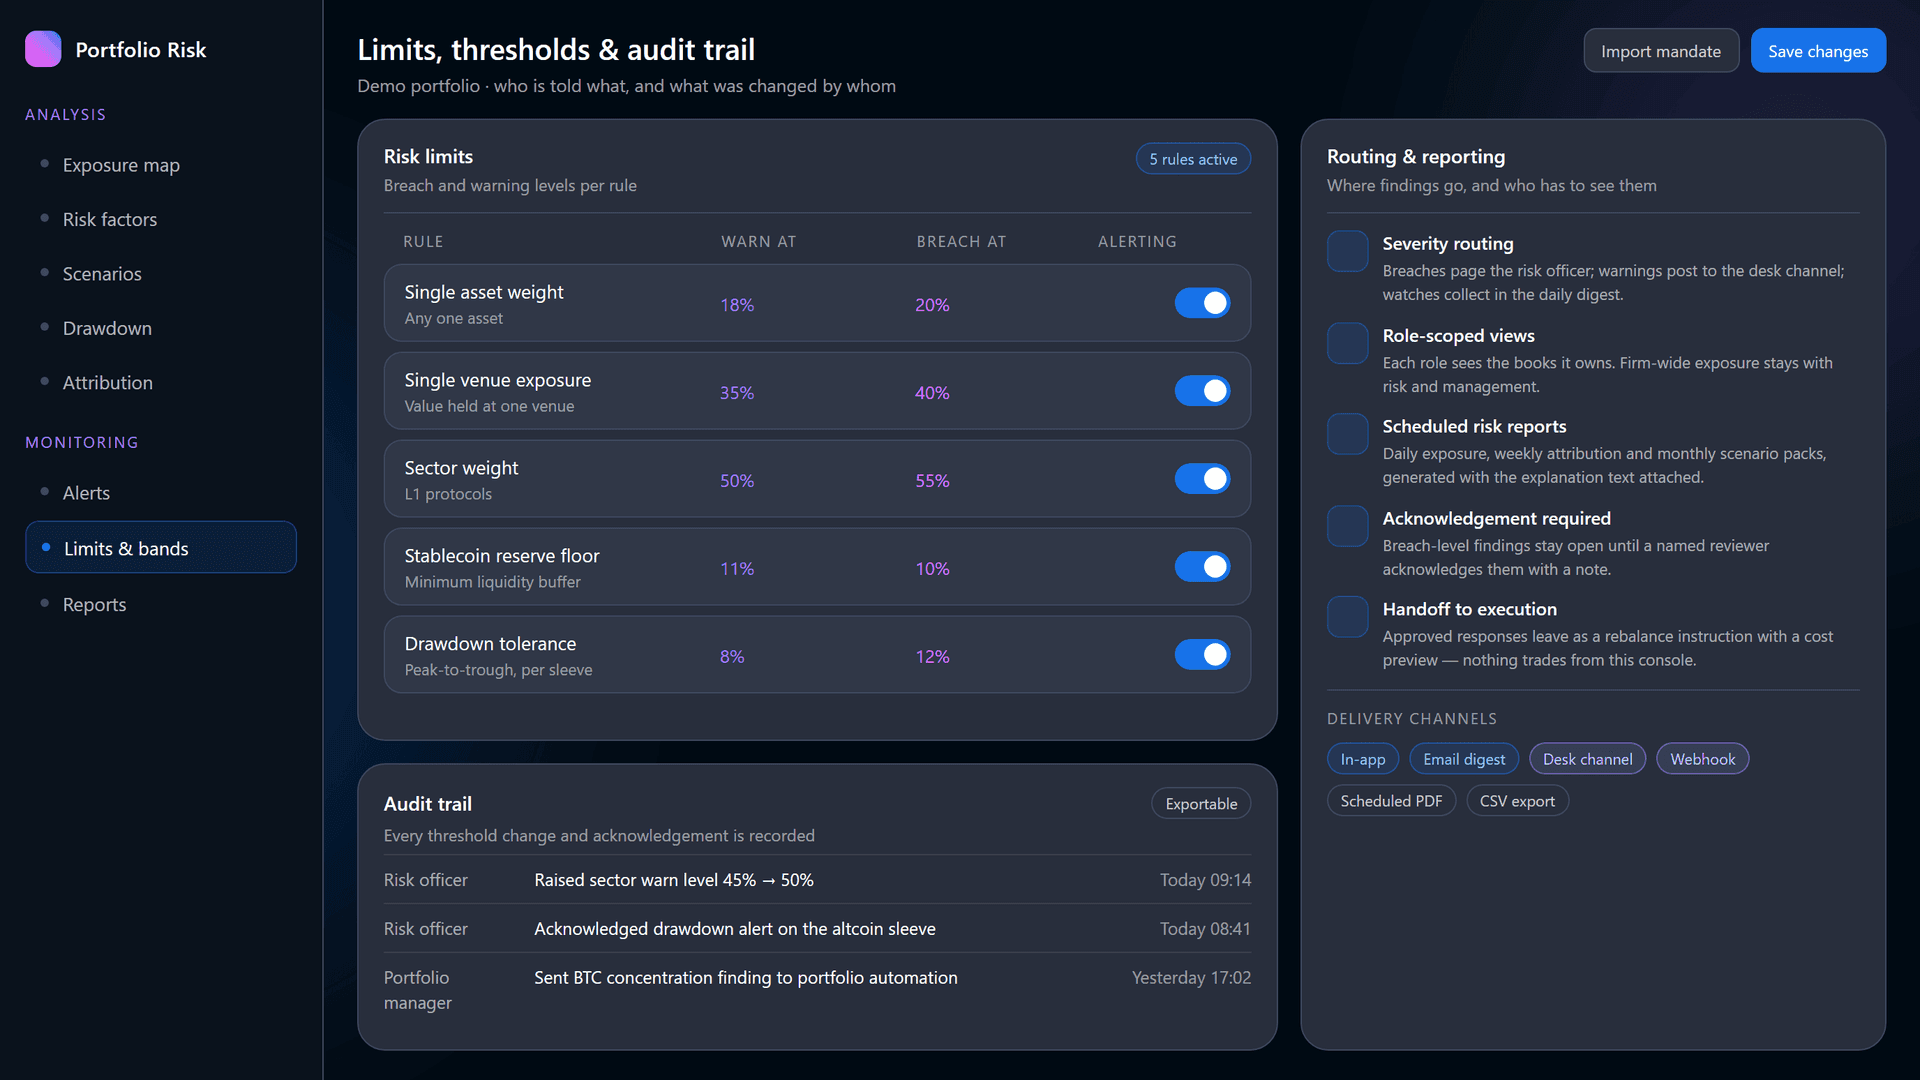
Caps, floors and tolerance bands per portfolio, with distance to every limit tracked and warning levels set below breach levels.

How much value sits where, so a concentration built through transfers rather than trading shows before it becomes a dependency.

Stablecoin and cash reserve floors tracked as first-class limits, raising a finding as the buffer approaches its floor, not after.

Define a market move, a depth reduction or correlations converging, then re-price current positions against it on a schedule.

Drawdown measured peak-to-trough per sleeve and per episode, with recovery tracked, so a deep move is judged in context.

Correlation tracked inside diversifying baskets, with a finding when a basket stops offsetting the exposure it was sized against.

Return decomposed by asset, sleeve, venue and period, showing where results came from and when they concentrated.

Every finding is written out before it is raised: what changed, which positions are responsible and the supporting numbers.

Breach, warning and watch levels with severity routing, delivered to the desk, to API or to webhooks under the same permissions.
An approved risk finding leaves as a rebalance instruction with a cost preview, executed under the automation layer approvals.
Portfolio risk is one workflow in the wider intelligence layer, sharing the same models, permissions and audit trail.
The dividing line is deliberate: Coiny measures, explains and recommends, and a person sets every threshold and approves every response. Nothing in this table executes a trade.
| # | Risk area | What Coiny computes and explains | What the operator decides |
|---|---|---|---|
| 1 | Exposure | Weights by asset, venue, sector and bookConsolidated across accounts and wallets | The mandate bands each weight must respect |
| 2 | Concentration | Distance to every cap and floorWarning level below breach level | Whether a breach is trimmed or accepted with a note |
| 3 | Correlation | Rolling correlation inside diversifying basketsCluster detection across the portfolio | The correlation tolerance for each basket |
| 4 | Drawdown | Peak-to-trough by sleeve, with episodes and recoveryMeasured against configured tolerance | Tolerance levels and who is notified at each one |
| 5 | Scenarios | Current positions re-priced under a defined shockLoss contribution named by sleeve | Which shocks matter for this mandate, and how often they run |
| 6 | Attribution | Return decomposed by asset, sleeve, venue and periodIncluding concentration of returns | What the reporting pack contains and who receives it |
| 7 | Alerts | The written why behind every finding, ranked by severityEvidence and suggested response attached | Acknowledgement, escalation and the action taken |
A risk system is only trusted if the people relying on it can see how it was configured and who changed it. Limits, routing, visibility and acknowledgement are all operator-controlled, and the audit trail is exportable.
Risk officers, treasury leads and institutional portfolio managers who have to answer for exposure — to a committee, an investor or a regulator.
Continuous exposure, correlation and drawdown monitoring with the explanation already written, so committee questions answer themselves.
Concentration, reserve floors and counterparty exposure watched against a mandate, with alerts routed to whoever owns the balance sheet.
Attribution that separates market direction from sizing and from individual names, plus scenario runs against the current book.
The same analysis offered to institutional clients inside a branded platform, sharing the permissions and audit model already in the stack.
Crypto portfolio risk analytics is the practice of measuring how much risk a digital asset portfolio is actually carrying, and why. Coiny Exchange's Portfolio Analytics & Risk maps exposure by asset, venue and sector, tracks correlation and drawdown, runs scenario shocks against live positions, and attributes performance to its sources. Every finding it raises arrives with a plain-language explanation of what changed and which positions caused it.
Scenario stress testing re-prices a portfolio under a hypothetical market move to show what would happen before it happens. In Coiny Exchange's Portfolio Analytics & Risk, the operator defines the shock — a market-wide drop, an altcoin-specific move, thinner order books, or correlations converging — and the system re-values every position, shows which sleeves drive the modelled loss, and flags the limits that would breach. Results are modelled outcomes, not forecasts.
Concentration risk is the exposure created when too much of a portfolio depends on one asset, one venue, one sector or one counterparty. Coiny Exchange measures concentration against the mandate bands an operator configures and raises a finding when a band is approached or breached — including the common case where a weight drifts through its cap on price movement alone, with no trading at all.
Performance attribution breaks a portfolio's return into the exposures and decisions that produced it, instead of reporting one number. Coiny Exchange's Portfolio Analytics & Risk attributes results across assets, sleeves, venues and time, so a portfolio manager can separate broad market movement from position sizing and from individual names. The same view shows when returns have quietly concentrated into a small number of positions.
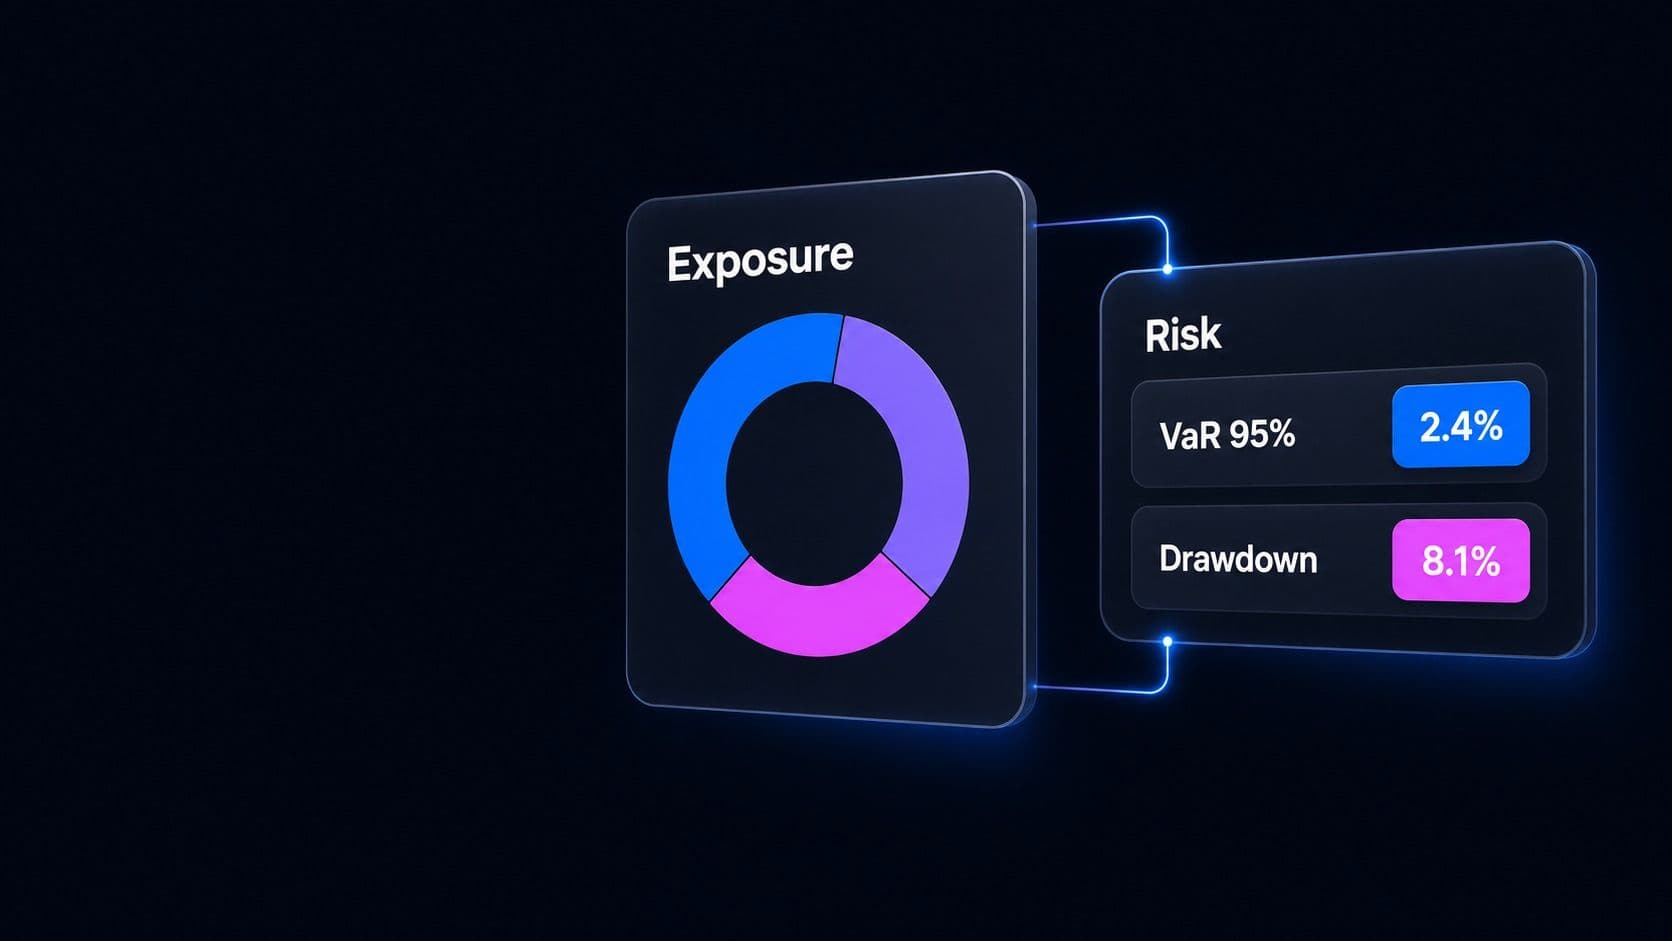
Yes. Value at risk (VaR) is one of several measures Coiny Exchange's Portfolio Analytics & Risk reports, alongside exposure concentration, rolling correlation, drawdown and scenario results. VaR is treated as a summary statistic rather than a verdict: each figure is presented with the positions and factors driving it, because a single risk number tells a risk officer that something changed but never why it changed.
Portfolio risk monitoring needs four inputs: current positions and balances across every account, venue and wallet; market data for prices, volatility and order-book depth; the trade and transfer history behind those positions; and the mandate itself — the caps, bands and tolerances the portfolio must respect. Coiny Exchange's Portfolio Analytics & Risk consolidates all four and recomputes continuously as positions change.
A risk alert without an explanation forces the reader to reconstruct the cause before they can act, which is where most monitoring tools stop. In Coiny Exchange's Portfolio Analytics & Risk, every alert opens with a written account of what changed, which positions are responsible, the factors driving it, the supporting numbers, and a suggested response — so a risk officer can decide rather than investigate.
Walk through the exposure map, run a scenario shock against real positions, and read the explanation behind a live finding — then decide whether a risk system that shows its reasoning changes how your desk works.
Book a Demo